One pane of glass for every study you run.
Real-time dashboards across sites, subjects and studies — enrollment, query aging, data completeness, deviations and safety signals on top of trusted, integrated clinical data.
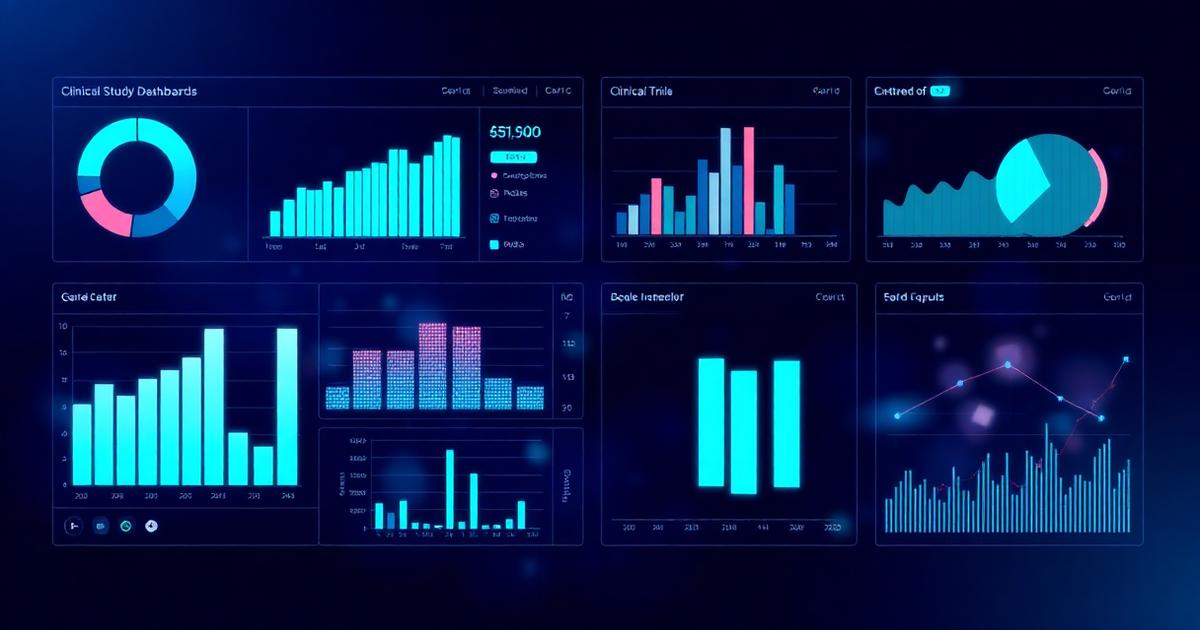
Dashboards we build out of the box
Enrollment & retention
Funnel from screened → consented → enrolled → completed, sliced by site, region and arm.
Data completeness
% complete by visit, form and site — with drill-through to the missing fields.
Query aging
Open queries, age buckets and site responsiveness with SLA tracking.
Safety signals
AE/SAE counts, MedDRA roll-ups and anomaly flags surfaced to medical monitors.
Protocol deviations
Deviation type, severity and trend lines surfaced before they become findings.
Operational KPIs
Site activation, randomization rate, drug accountability and monitoring visit status.
From raw study data to a usable dashboard
Ingest
2 weeksStream EDC, EHR, lab, ePRO and CTMS data into a governed lakehouse zone with full audit trail.
- Source credentials & schemas
- Refresh SLA agreed per source
- PHI handling policy
- Raw + curated lakehouse zones
- Source freshness monitors
- Audit & lineage capture
What live dashboards actually change
Production-grade dashboards, not screenshots
- Study-centric semantic layer (dbt or LookML)
- Site, subject, visit and arm dimensions
- Pre-built KPI library aligned to TransCelerate / RBM
- Role-based access for sponsor, CRO and site users
- Alerting on metric SLA breaches
- Embed-ready dashboards for portals
- Audit logs and HIPAA-aligned access controls
- Quarterly metric review and tuning
Dashboard questions
Which BI tool do we have to use?+
Whichever your team already runs on. We ship in Looker, Power BI, Tableau or Mode — backed by the same semantic model.
Can dashboards combine multiple studies?+
Yes. The semantic layer is study-aware, so portfolio views and per-study deep dives reuse the same definitions.
Will this work for adaptive or decentralized trials?+
Yes. The model handles changing arms, ePRO ingestion and multi-site decentralized designs.
How fresh is the data?+
Typically minutes for streamed sources, and within an hour for batch sources — tunable per metric.
Ready to retire the weekly status PDF?
Share your top 5 study KPIs — we'll come back with a live mock and an integration plan.
- ✓ Senior engineer reviews your inquiry
- ✓ Reply within 1 business day
- ✓ US-based, HIPAA-aware
- ✓ Scoped plan in 48 hours